这篇教程混淆矩阵可视化写得很实用,希望能帮到您。
混淆矩阵可视化
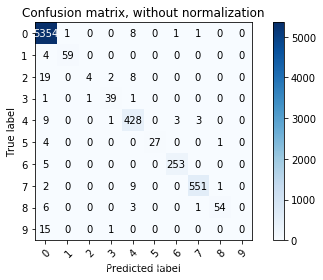
混淆矩阵的可视化可以让多分类问题变得更加明了,在使用了几个别人写的案例后都不太理想,于是通过官网上的例子进行了一下小小的修改,得到了自己满意的结果。
环境:jupyter Notebook
aa=[[5354,1,0,0,8,0,1,1,0,0],
 [4,59,0,0,0,0,0,0,0,0],
 [19,0,4,2,8,0,0,0,0,0],
 [1,0,1,39,1,0,0,0,0,0],
 [9,0,0,1,428,0,3,3,0,0],
 [4,0,0,0,0,27,0,0,1,0],
 [5,0,0,0,0,0,253,0,0,0],
 [2,0,0,0,9,0,0,551,1,0],
 [6,0,0,0,3,0,0,1,54,0],
 [15,0,0,1,0,0,0,0,0,0]]

 def plot_confusion_matrix(cm, classes,
                          normalize=False,
                          title=None,
                          cmap=plt.cm.Blues):
    """
    This function prints and plots the confusion matrix.
    Normalization can be applied by setting `normalize=True`.
    """
    if not title:
        if normalize:
            title = 'Normalized confusion matrix'
        else:
            title = 'Confusion matrix, without normalization'

    # Compute confusion matrix

    # Only use the labels that appear in the data
    #     classes = classes[unique_labels(y_true, y_pred)]
    if normalize:
        cm = cm.astype('float') / cm.sum(axis=1)[:, np.newaxis]
        print("Normalized confusion matrix")
    else:
        print('Confusion matrix, without normalization')

    print(cm)

    fig, ax = plt.subplots()
    im = ax.imshow(cm, interpolation='nearest', cmap=cmap)
    ax.figure.colorbar(im, ax=ax)
    # We want to show all ticks...
    ax.set(xticks=np.arange(cm.shape[1]),
           yticks=np.arange(cm.shape[0]),
           # ... and label them with the respective list entries
           xticklabels=classes, yticklabels=classes,
           title=title,
           ylabel='True label',
           xlabel='Predicted label')

    # Rotate the tick labels and set their alignment.
    plt.setp(ax.get_xticklabels(), rotation=45, ha="right",
             rotation_mode="anchor")

    # Loop over data dimensions and create text annotations.
    fmt = '.2f' if normalize else 'd'
    thresh = cm.max() / 2.
    for i in range(cm.shape[0]):
        for j in range(cm.shape[1]):
            ax.text(j, i, format(cm[i, j], fmt),
                    ha="center", va="center",
                    color="white" if cm[i, j] > thresh else "black")
    fig.tight_layout()
    plt.show()
    return ax
aa = np.array(aa)
plot_confusion_matrix(aa,classes=range(10))
Python 批量修改文件名
L单目标差分进化算法 |