这篇教程Python绘制直方图的示例代码写得很实用,希望能帮到您。
初步对于大量样本来说,如果想快速获知其分布特征,最方便的可视化方案就是直方图,即统计落入不同区间中的样本个数。 以正态分布为例 import numpy as npimport matplotlib.pyplot as pltxs = np.random.normal(0, 1, size=(5000))fig = plt.figure()for i,b in enumerate([10, 50, 100, 200],1): ax = fig.add_subplot(2,2,i) plt.hist(xs, bins=b)plt.show() 其中bins参数用于调控区间个数,出图结果如下 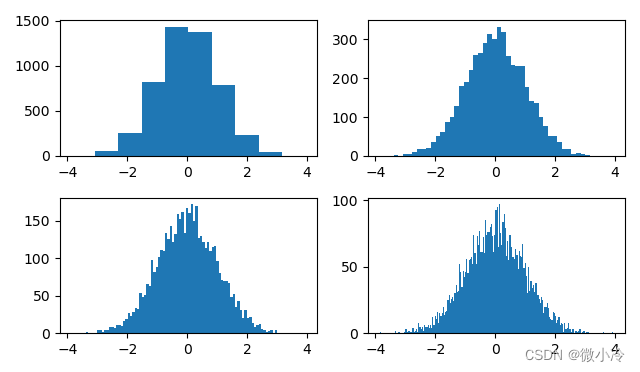
参数直方图函数的定义如下 hist(x, bins=None, range=None, density=False, weights=None, cumulative=False, bottom=None, histtype='bar', align='mid', orientation='vertical', rwidth=None, log=False, color=None, label=None, stacked=False, *, data=None, **kwargs) 除了x和bins之外,其他参数含义为 - range 绘图区间,默认将样本所有范围纳入其中
- density 为
True时,纵坐标单位是占比 - weights 与
x个数相同,表示每个值所占权重 - cumulative 为
True时,将采取累加模式 - bottom y轴起点,有了这个,可以对直方图进行堆叠
- histtype 绘图类型
- align 对其方式,可选left, mid, right三种,代表左中右
- oritentation 绘制方向,可选vertical和horizontal两种
- rwitdth 数据条宽度
- log 为
True时,开启对数坐标 - color, label 颜色,标签
- stacked
绘图类型histtype共有4个选项,分别是bar, barstacked, step以及stepfilled,其中barstacked表示堆叠,下面对另外三种参数进行演示
types = ['bar', 'step', 'stepfilled']fig = plt.figure()for i,t in enumerate(types,1): ax = fig.add_subplot(1,3,i) plt.hist(xs, bins=50, histtype=t, rwidth=0.5)plt.show() 效果如下 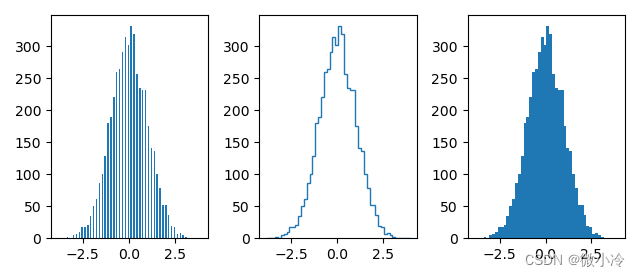
堆叠直方图,就是把多个直方图叠在一起 bins = [10, 30, 100]ws = [1, 0.7, 0.5]for b,w in zip(bins, ws): print(b,w) plt.hist(xs, bins=b, density=True, histtype='barstacked', rwidth = w, alpha=w)plt.show() 效果如下 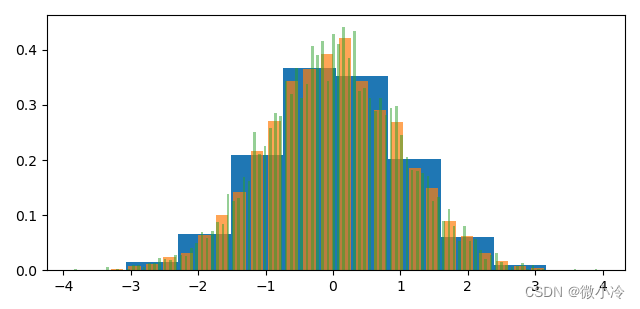
多组数据直方图对比直方图中设置了rwidth选项,这意味着可以通过合理安排数据条宽度,以实现多组数据直方图在一个图像中更加 N = 10000labels = ["norm", "power", "poisson"]data = np.array([ np.random.normal(0, 1, size=N)**2, np.random.power(5, size=N), np.random.uniform(0, 1, size=N)]).Tplt.hist(data, 50, density=True, range=(0,1), label=labels)plt.legend()plt.show() 其中,data为3组统计数据,hist函数会自行规划画布,效果如下 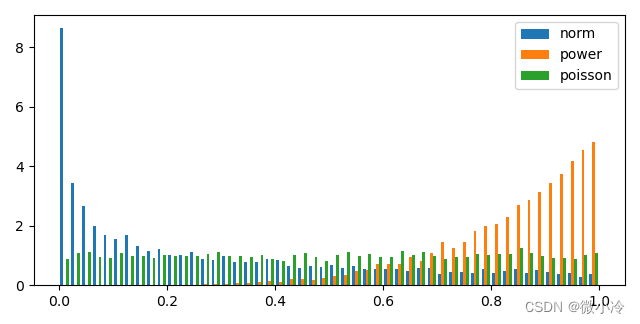
到此这篇关于Python绘制直方图的示例代码的文章就介绍到这了,更多相关Python绘制直方图内容请搜索51zixue.net以前的文章或继续浏览下面的相关文章希望大家以后多多支持51zixue.net!
Python 中借助日志记录库使用 Log4j的过程记录
macbook安装环境chatglm2-6b的详细过程 |


