��ƪ�̳�����Python����PPT����������д�ú�ʵ�ã�ϣ���ܰﵽ����
ǰ����ô���㻹ûѧPython��? ��һʱ����ʱ��ʲôC��JAVA����������ְ�г���������������ǵص�Pythonѧϰ��棬һ����һ������������ң����Ѿ�����: �ϰ�˵:���Ŭ��,���һ�������λ�Python���ˡ� Ա��˵���Դ�ѧ��Python,�������ˣ��Ȳ����ˣ�����ʹ�ˣ������ʶ����ˡ����� ��ũ˵����Ҫ͵͵ѧPython�����������ˣ� ������������
���ԣ�Ϊ�˲���ʱ������������̭����ȡץ��ʱ��ǰ����ĩ�����ҲҪѧPython�ˣ�����ʵ�õ�-�İ�������PPT��ţ�ƣ����� ���濪ʼ��������
����1��Python���ڲ�ͬ�汾֮��ļ��������⣬�����б�Ҫ˵��һ�°汾����������Ubuntuϵͳ��ʹ��Python3Ϊ����������ϵͳ����Python3.�밴�����²����ģ� caozilong@caozilong-Vostro-3268:/usr/bin$ sudo rm python caozilong@caozilong-Vostro-3268:/usr/bin$ sudo ln -s /usr/bin/python3 /usr/bin/python caozilong@caozilong-Vostro-3268:/usr/bin$
����2����װPIP3��װPIP3��Ŀ����Ϊ�˰�װ Python PPT�������ΪPython3�ϵİ��������ߣ�PIP3���ɻ�ȱ�� caozilong@caozilong-Vostro-3268:~/Workspace/python-ppt$ sudo apt install python3-pip[sudo] caozilong �����룺 ���ڶ�ȡ�������б�... ������ڷ�����������������ϵ�� ���ڶ�ȡ״̬��Ϣ... ��� python3-pip �Ѿ������°� (9.0.1-2.3~ubuntu1.18.04.5)���������������Զ���װ�IJ������ڲ���Ҫ�ˣ� libegl1-mesa libfwup1 libllvm9 python-kerberosʹ��'sudo apt autoremove'��ж����(����)�������� 0 �����������°�װ�� 0 ����������Ҫж�� 0 ������������ 10 ��������δ��������caozilong@caozilong-Vostro-3268:~/Workspace/python-ppt$
����3����װpython-pptxcaozilong@caozilong-Vostro-3268:~/Workspace/python-ppt$ sudo pip3 install python-pptxThe directory '/home/caozilong/.cache/pip/http' or its parent directory is not owned by the current user and the cache has been disabled. Please check the permissions and owner of that directory. If executing pip with sudo, you may want sudo's -H flag.The directory '/home/caozilong/.cache/pip' or its parent directory is not owned by the current user and caching wheels has been disabled. check the permissions and owner of that directory. If executing pip with sudo, you may want sudo's -H flag.Collecting python-pptx Downloading https://files.pythonhosted.org/packages/53/ed/547be9730350509253bc7d76631a8ffcd1a62dda4d7482fb25d369696e37/python-pptx-0.6.19.tar.gz (9.3MB) 100% |����������������������������������������������������������������| 9.3MB 180kB/s Requirement already satisfied: Pillow>=3.3.2 in /usr/lib/python3/dist-packages (from python-pptx)Collecting XlsxWriter>=0.5.7 (from python-pptx) Downloading https://files.pythonhosted.org/packages/93/51/11cb4545e95f1a845a6ca5475eb425272dc32c2f0e3592d80e7abd491374/XlsxWriter-1.4.4-py2.py3-none-any.whl (149kB) 100% |����������������������������������������������������������������| 153kB 5.9MB/s Collecting lxml>=3.1.0 (from python-pptx) Downloading https://files.pythonhosted.org/packages/1f/1d/a4485412268b38043a6c0f873245b5d9315c6615bcf44776759a2605dca5/lxml-4.6.3-cp36-cp36m-manylinux1_x86_64.whl (5.5MB) 100% |����������������������������������������������������������������| 5.5MB 295kB/s Installing collected packages: XlsxWriter, lxml, python-pptx Running setup.py install for python-pptx ... doneSuccessfully installed XlsxWriter-1.4.4 lxml-4.6.3 python-pptx-0.6.19caozilong@caozilong-Vostro-3268:~/Workspace/python-ppt$
4.д������ԣ�#!/usr/bin/env python3# -*- coding: utf-8 -*-from pptx import Presentation prs = Presentation()title_slide_layout = prs.slide_layouts[0]slide = prs.slides.add_slide(title_slide_layout)title = slide.shapes.titlesubtitle = slide.placeholders[1] title.text = "Hello, World!"subtitle.text = "python-pptx ������������powerpoint!" prs.save('czl.pptx') ִ�У� caozilong@caozilong-Vostro-3268:~/Workspace/python-ppt$ python py1.pycaozilong@caozilong-Vostro-3268:~/Workspace/python-ppt$ ls -l������ 32-rw-rw-r-- 1 caozilong caozilong 28292 7�� 18 15:51 czl.pptx-rw-rw-r-- 1 caozilong caozilong 362 7�� 18 15:51 py1.pycaozilong@caozilong-Vostro-3268:~/Workspace/python-ppt$ ��WPS��czl.pptx. 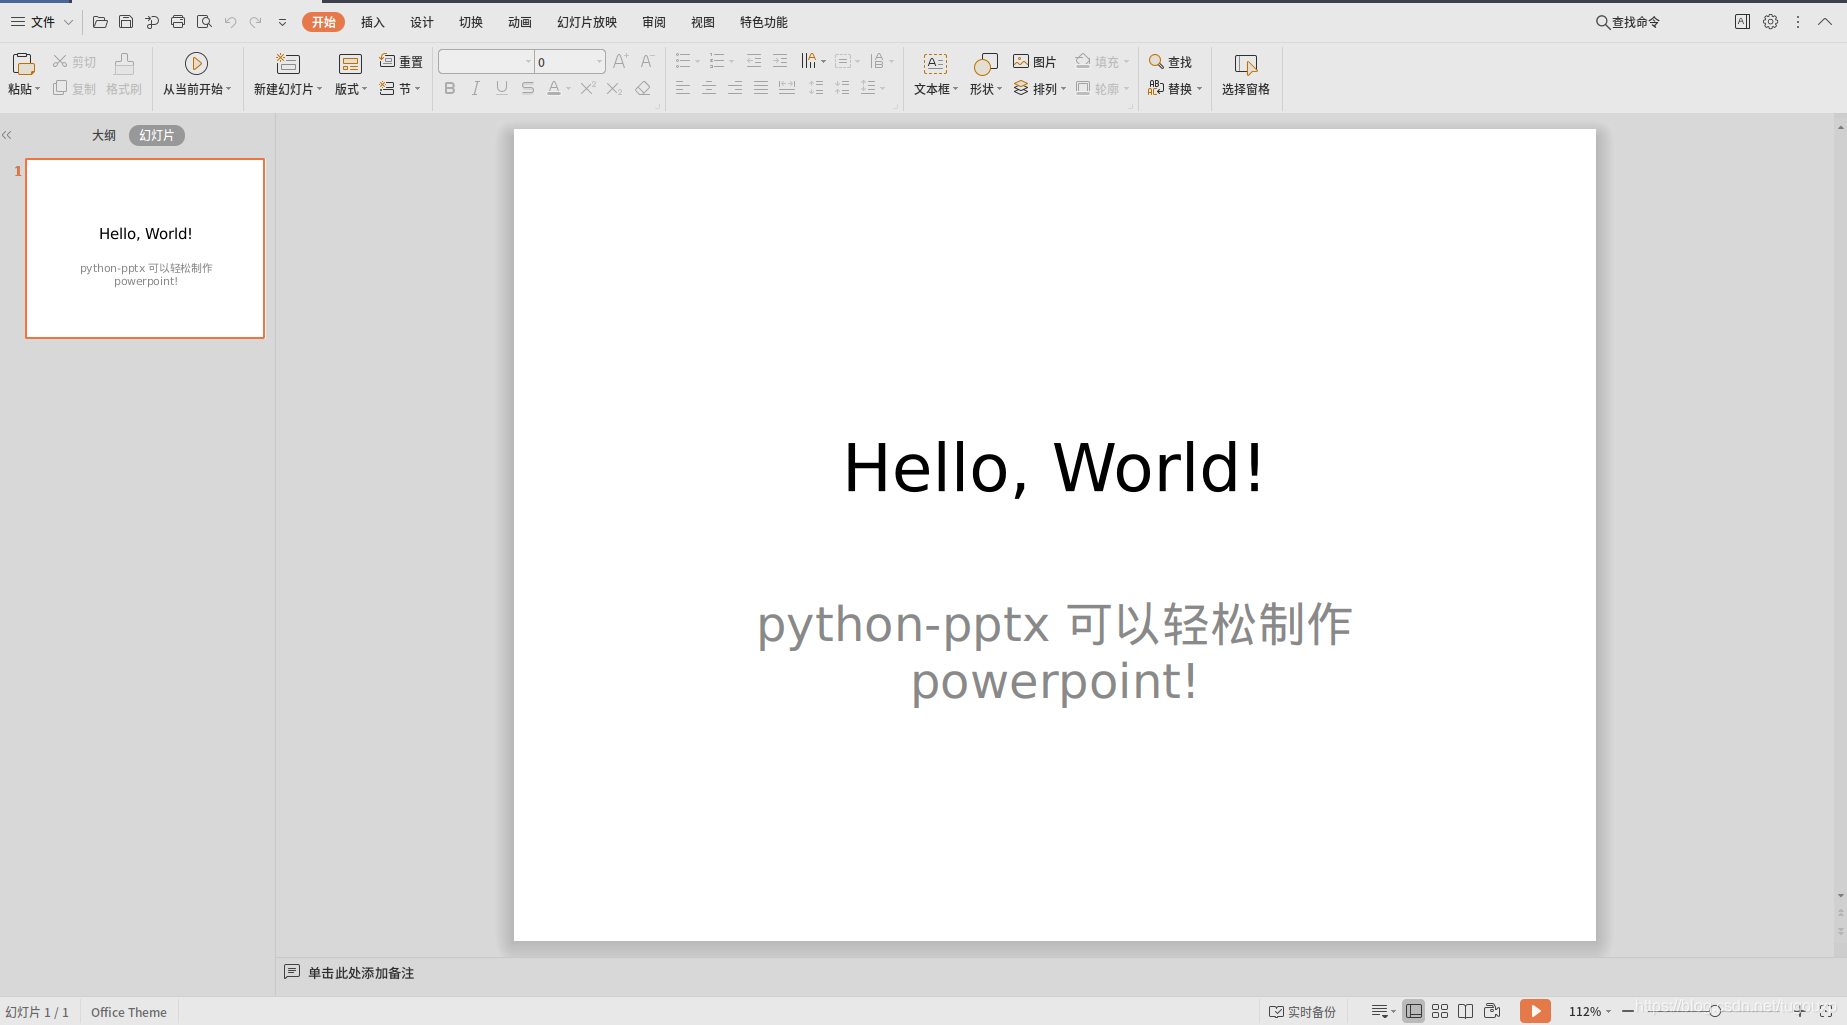
from pptx import Presentation prs = Presentation()bullet_slide_layout = prs.slide_layouts[1] slide = prs.slides.add_slide(bullet_slide_layout)shapes = slide.shapes title_shape = shapes.titlebody_shape = shapes.placeholders[1] title_shape.text = 'Adding a Bullet Slide' tf = body_shape.text_frametf.text = 'Find the bullet slide layout' p = tf.add_paragraph()p.text = 'Use _TextFrame.text for first bullet'p.level = 1 p = tf.add_paragraph()p.text = 'Use _TextFrame.add_paragraph() for subsequent bullets'p.level = 2 prs.save('czl.pptx')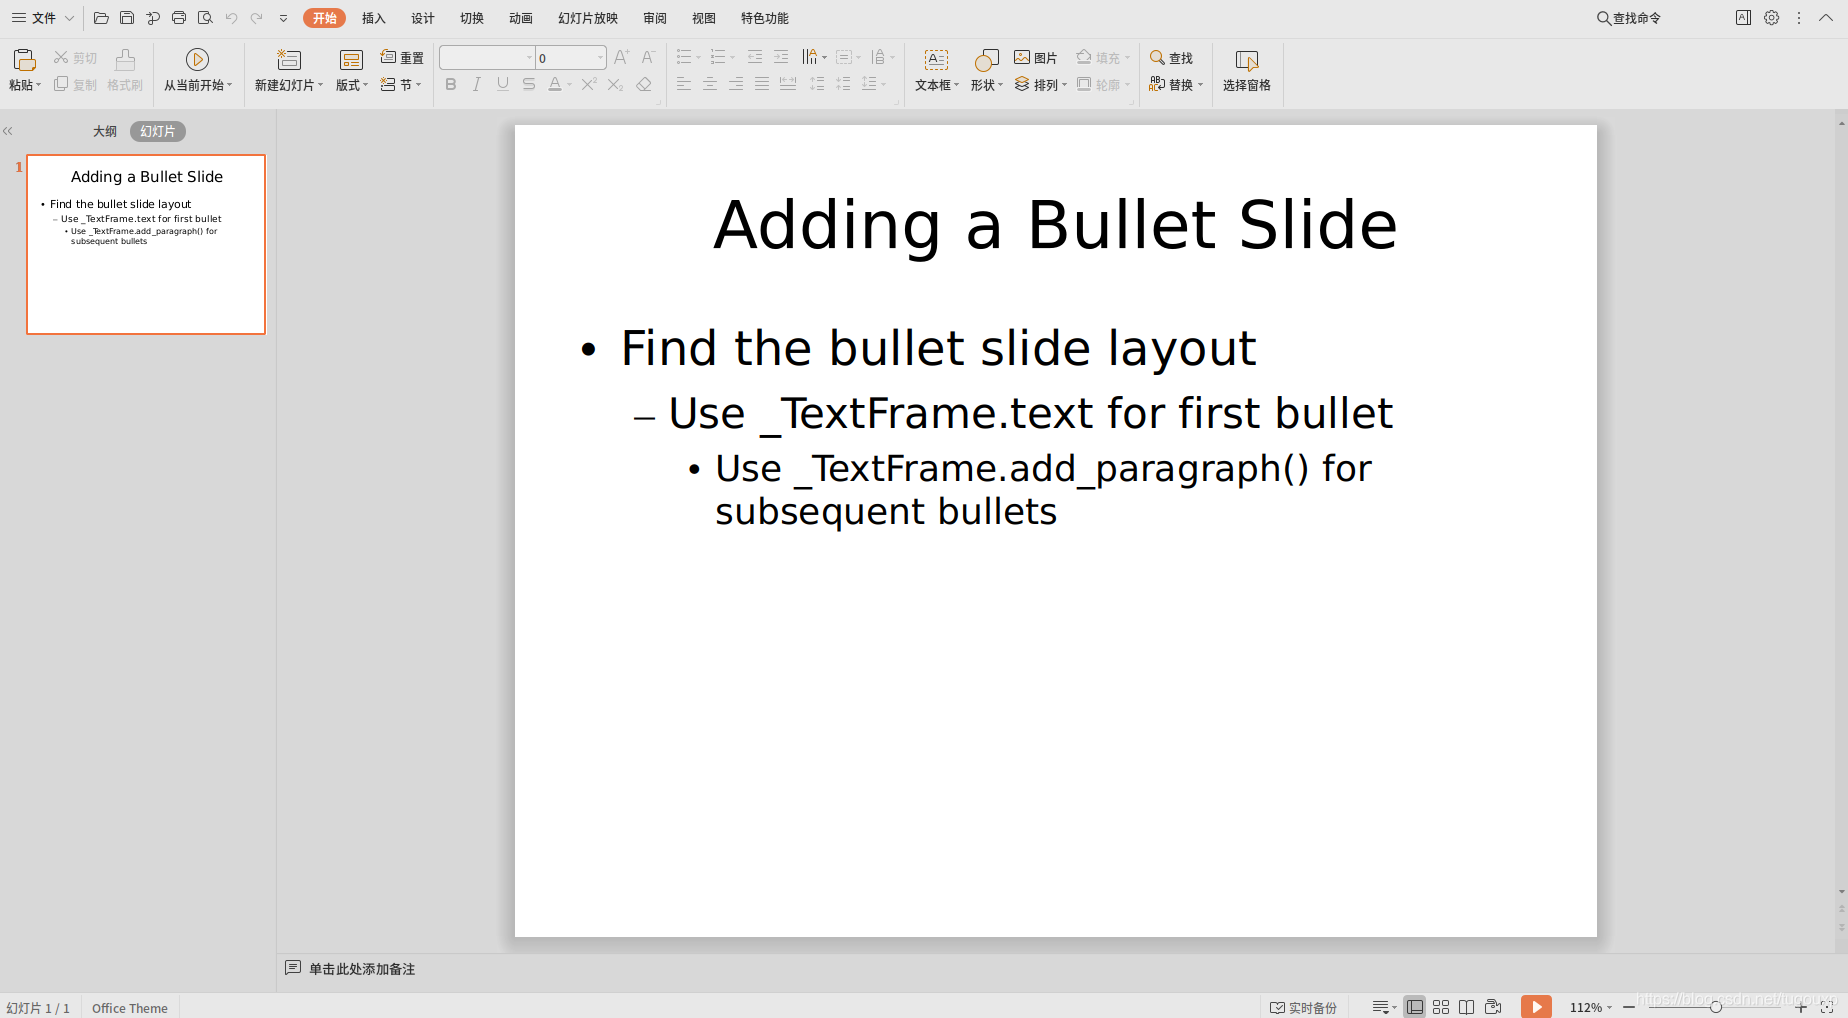
#!/usr/bin/env python3# -*- coding: utf-8 -*-from pptx import Presentationfrom pptx.enum.shapes import MSO_SHAPEfrom pptx.util import Inches prs = Presentation()title_only_slide_layout = prs.slide_layouts[5]slide = prs.slides.add_slide(title_only_slide_layout)shapes = slide.shapes shapes.title.text = 'Adding an AutoShape' left = Inches(0.93) # 0.93" centers this overall set of shapestop = Inches(3.0)width = Inches(1.75)height = Inches(1.0) shape = shapes.add_shape(MSO_SHAPE.PENTAGON, left, top, width, height)shape.text = 'Step 1' left = left + width - Inches(0.4)width = Inches(2.0) # chevrons need more width for visual balance for n in range(2, 6): shape = shapes.add_shape(MSO_SHAPE.CHEVRON, left, top, width, height) shape.text = 'Step %d' % n left = left + width - Inches(0.4) prs.save('test.pptx')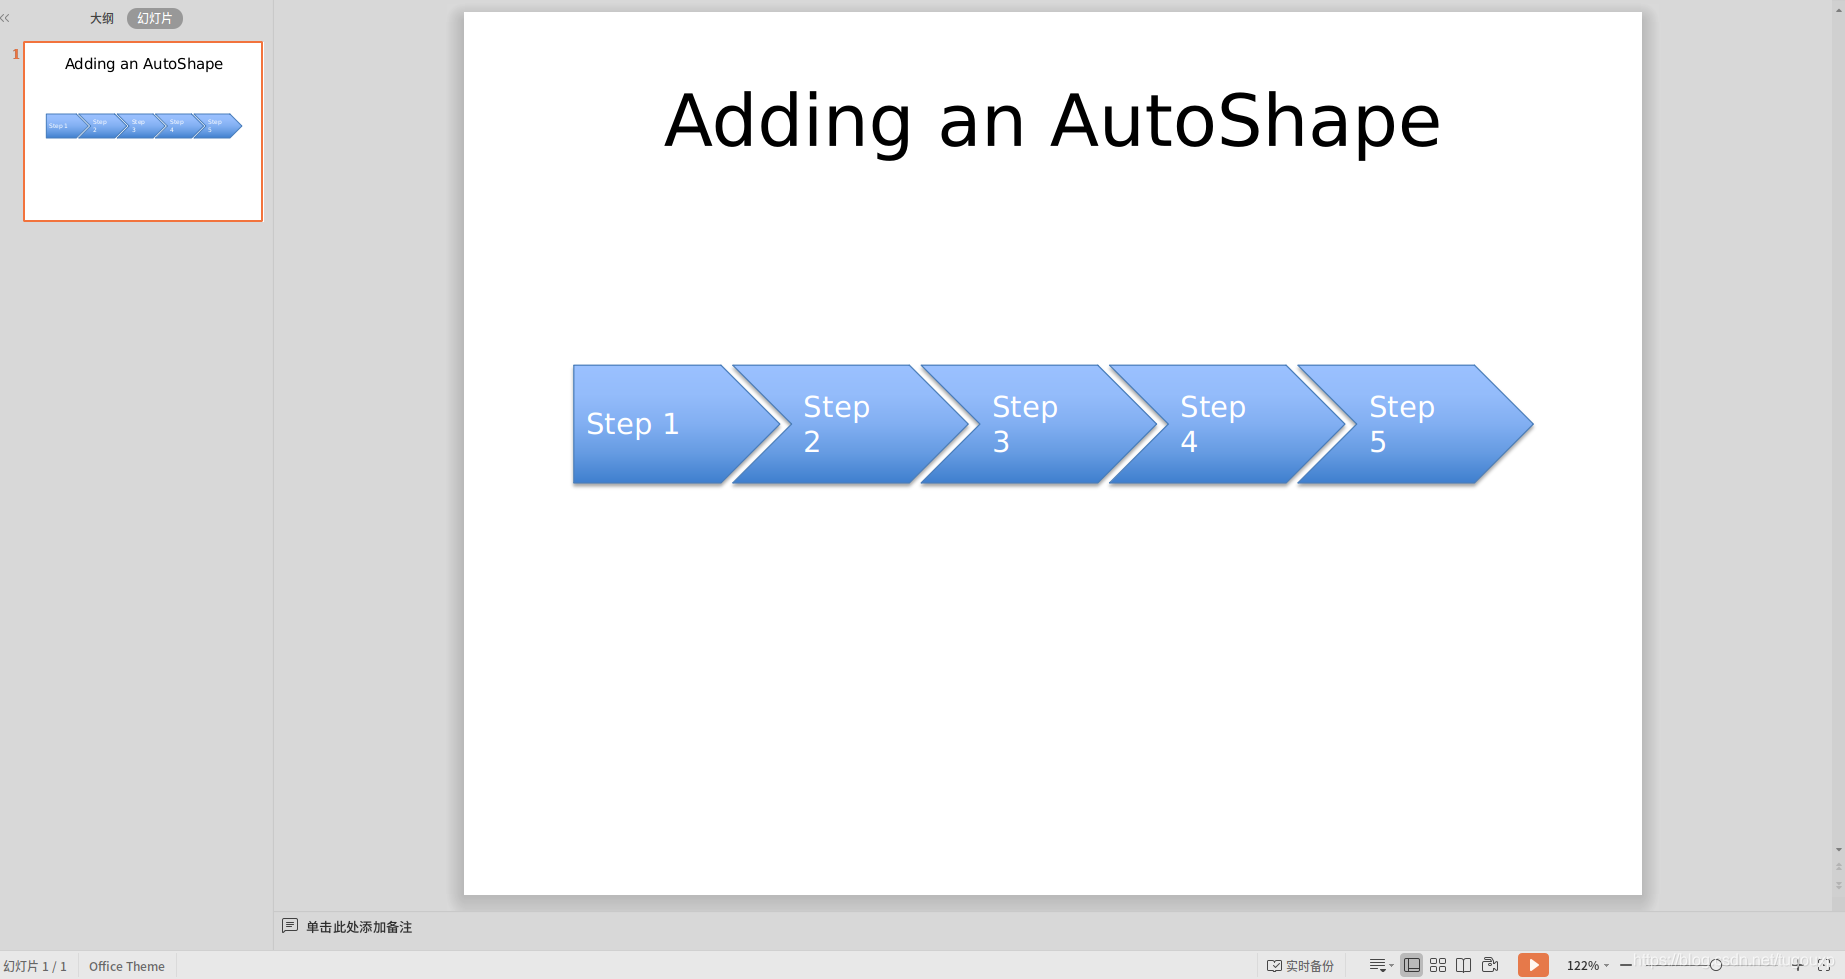
from pptx import Presentationfrom pptx.chart.data import CategoryChartDatafrom pptx.enum.chart import XL_CHART_TYPEfrom pptx.util import Inches # create presentation with 1 slide ------prs = Presentation()slide = prs.slides.add_slide(prs.slide_layouts[5]) # define chart data ---------------------chart_data = CategoryChartData()chart_data.categories = ['East', 'West', 'Midwest']chart_data.add_series('Series 1', (19.2, 21.4, 16.7)) # add chart to slide --------------------x, y, cx, cy = Inches(2), Inches(2), Inches(6), Inches(4.5)slide.shapes.add_chart( XL_CHART_TYPE.COLUMN_CLUSTERED, x, y, cx, cy, chart_data) prs.save('chart-01.pptx')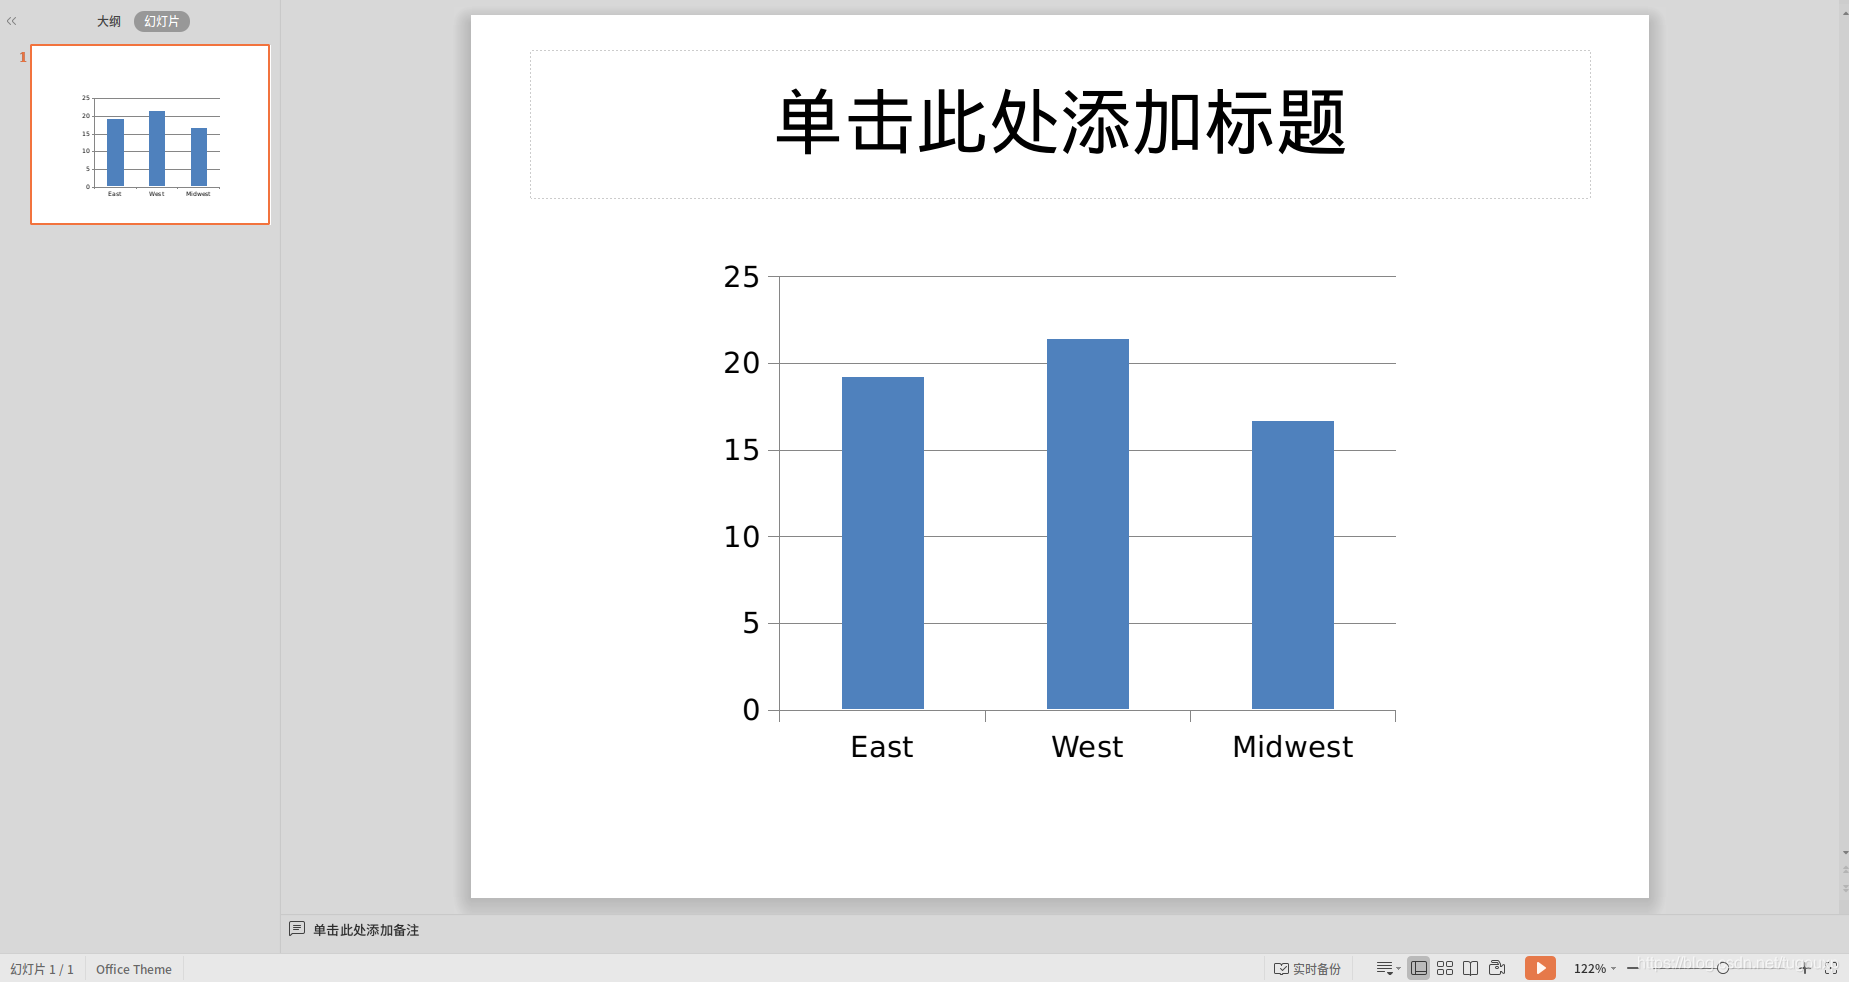
from pptx import Presentationfrom pptx.util import Inchesfrom pptx import Presentationfrom pptx.chart.data import ChartDatafrom pptx.enum.chart import XL_CHART_TYPEfrom pptx.util import Cm #Inchesfrom pptx.enum.chart import XL_LEGEND_POSITION if __name__ == '__main__': # �����õ�Ƭ ------ prs = Presentation('template.pptx') title_only_slide_layout = prs.slide_layouts[5] slide = prs.slides.add_slide(title_only_slide_layout) shapes = slide.shapes shapes.title.text = '����' # ����������� ------ name_objects = ["object1", "object2", "object3"] name_AIs = ["AI1", "AI2", "AI3"] val_AI1 = (19.2, 21.4, 16.7) val_AI2 = (22.3, 28.6, 15.2) val_AI3 = (20.4, 26.3, 14.2) val_AIs = [val_AI1, val_AI2, val_AI3] # ������ʽ -------------------- rows = 4 cols = 4 top = Cm(12.5) left = Cm(3.5) #Inches(2.0) width = Cm(24) # Inches(6.0) height = Cm(6) # Inches(0.8) # ���ӱ��õ�Ƭ -------------------- table = shapes.add_table(rows, cols, left, top, width, height).table # ���õ�Ԫ����� table.columns[0].width = Cm(6)# Inches(2.0) table.columns[1].width = Cm(6) table.columns[2].width = Cm(6) table.columns[3].width = Cm(6) # ���ñ����� table.cell(0, 1).text = name_objects[0] table.cell(0, 2).text = name_objects[1] table.cell(0, 3).text = name_objects[2] # ������� table.cell(1, 0).text = name_AIs[0] table.cell(1, 1).text = str(val_AI1[0]) table.cell(1, 2).text = str(val_AI1[1]) table.cell(1, 3).text = str(val_AI1[2]) table.cell(2, 0).text = name_AIs[1] table.cell(2, 1).text = str(val_AI2[0]) table.cell(2, 2).text = str(val_AI2[1]) table.cell(2, 3).text = str(val_AI2[2]) table.cell(3, 0).text = name_AIs[2] table.cell(3, 1).text = str(val_AI3[0]) table.cell(3, 2).text = str(val_AI3[1]) table.cell(3, 3).text = str(val_AI3[2]) # ����ͼ������ --------------------- chart_data = ChartData() chart_data.categories = name_objects chart_data.add_series(name_AIs[0], val_AI1) chart_data.add_series(name_AIs[1], val_AI2) chart_data.add_series(name_AIs[2], val_AI3) # ����ͼ�����õ�Ƭ -------------------- x, y, cx, cy = Cm(3.5), Cm(4.2), Cm(24), Cm(8) graphic_frame = slide.shapes.add_chart( XL_CHART_TYPE.COLUMN_CLUSTERED, x, y, cx, cy, chart_data ) chart = graphic_frame.chart chart.has_legend = True chart.legend.position = XL_LEGEND_POSITION.TOP chart.legend.include_in_layout = False value_axis = chart.value_axis value_axis.maximum_scale = 100.0 value_axis.has_title = True value_axis.axis_title.has_text_frame = True value_axis.axis_title.text_frame.text = "False positive" value_axis.axis_title.text_frame.auto_size prs.save('test_template.pptx')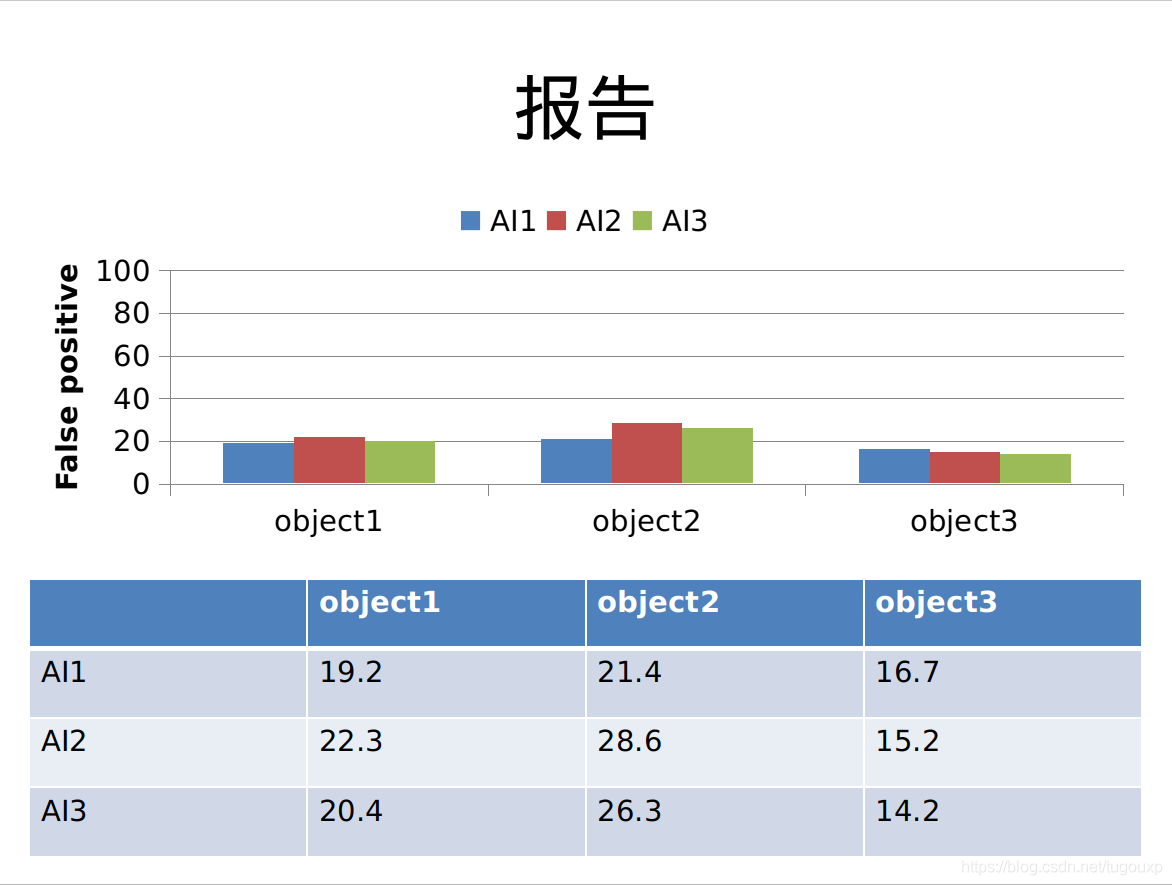
����������PPTĿ¼,��ÿ���ļ�������ţ� caozilong@caozilong-Vostro-3268:~/Workspace/python-ppt$ ls -l *.pptx-rw-rw-r-- 1 caozilong caozilong 28292 7�� 18 16:05 1.template.pptx-rw-rw-rw- 1 caozilong caozilong 165 7�� 18 15:59 2..~test.pptx-rw-rw-r-- 1 caozilong caozilong 28292 7�� 18 16:05 3.czl.pptx-rw-rw-rw- 1 caozilong caozilong 165 7�� 18 15:53 4..~czl.pptx-rw-rw-r-- 1 caozilong caozilong 35873 7�� 18 16:06 5.test_template.pptx-rw-rw-rw- 1 caozilong caozilong 165 7�� 18 16:06 6..~test_template.pptxcaozilong@caozilong-Vostro-3268:~/Workspace/python-ppt$ Python ��ͼ�� import matplotlib.pyplot as pltfrom pylab import * mpl.rcParams['font.sans-serif'] = ['SimHei'] """����ͼbar"""x = ['10/Q1', '10/Q3', '11/Q1', '11/Q3', '12/Q1', '12/Q3', '13/Q1', '13/Q3', '14/Q1', '14/Q3', '15/Q1', '15/Q3', '16/Q1', '16/Q3', '17/Q1', '17/Q3']y = [20, 35, 39, 62, 87, 114, 140, 169, 187, 211, 225, 239, 241, 247, 251, 258] # plt.bar([1,3,5,7,9],[5,2,7,8,2],label='Example One',color='b')#plt.bar��������ͼ# plt.bar([2,4,6,8,10],[8,6,2,5,6],label='Example Two',color='g') plt.bar(range(16), y, color = 'lightsteelblue')plt.plot(range(16), y, marker = 'o', color = 'coral') #coralplt.xticks(range(16), x)plt.xlabel('year/month')plt.ylabel("active customer/month")plt.legend()plt.show()
import matplotlib.pyplot as pltimport numpy as npimport matplotlib.patches as mpatchesplt.subplots_adjust(left=0.00, bottom=0.0, right=1.00, top=0.95, wspace=0.0, hspace=0.00) def hexagon_with_text(ax,x,y,text,size,**kwargs): xy=np.array([x,y]) hexagon = mpatches.RegularPolygon(xy, 6, radius=size,facecolor='#5472bb',edgecolor='#3f597c', orientation=np.pi / 2) ax.add_patch(hexagon) ax.text(xy[0],xy[1],text,fontsize=size*14,color='white',va='center',ha='center') def circle_with_text(ax,x,y,text,size,**kwargs): xy=np.array([x,y]) circle = mpatches.Circle(xy, radius=size,facecolor='#83aa51',edgecolor='#546538') ax.add_patch(circle) ax.text(xy[0],xy[1],text,fontsize=size*14,color='white',va='center',ha='center') def arrow(ax,x,y,size,**kwargs): ax.plot(x,y,**kwargs) theta=np.arctan2(x[1]-x[0],y[1]-y[0]) xy=np.array([x[1]-size*np.sin(theta),y[1]-size*np.cos(theta)]) triangle = mpatches.RegularPolygon(xy, 3, radius=size,color=kwargs['color'], orientation=-theta) ax.add_patch(triangle) def arrow_with_rad(ax,x,y,radius,size,**kwargs): d=np.sqrt((x[1]-x[0])**2+(y[1]-y[0])**2) theta=np.arctan2(x[1]-x[0],y[0]-y[1]) x0=(x[0]+x[1])/2+np.cos(theta)*np.sqrt(radius**2-(d/2)**2) y0=(y[0]+y[1])/2+np.sin(theta)*np.sqrt(radius**2-(d/2)**2) theta1=np.arctan2(y[0]-y0,x[0]-x0) theta2=np.arctan2(y[1]-y0,x[1]-x0) arc_x = [] arc_y = [] for theta in np.arange(theta1,theta2+(np.pi*2),np.pi/180): temp_x=x0 + radius * np.cos(theta) temp_y=y0 + radius * np.sin(theta) if((temp_x-x[0])**2+(temp_y-y[0])**2>1 and (temp_x-x[1])**2+(temp_y-y[1])**2>1): arc_x.append(temp_x) arc_y.append(temp_y) ax.plot(arc_x,arc_y,**kwargs) theta=np.arctan2(arc_y[-2]-arc_y[-1],arc_x[-2]-arc_x[-1]) xy=np.array([arc_x[-1]+size*np.cos(theta),arc_y[-1]+size*np.sin(theta)]) triangle = mpatches.RegularPolygon(xy, 3, radius=size,color=kwargs['color'], orientation=np.pi/2+theta) ax.add_patch(triangle) ax=plt.subplot(1,1,1,aspect='equal')ax.axis('off') circle_with_text(ax,2,23,'$/mathrm{U_{1}}$',1)circle_with_text(ax,2,20,'$/mathrm{U_{2}}$',1)circle_with_text(ax,2,17,'$/mathrm{U_{3}}$',1)circle_with_text(ax,2,14,'$/mathrm{U_{4}}$',1) hexagon_with_text(ax,8,22.5,'$/mathrm{I_{1}}$',1)hexagon_with_text(ax,8,18.5,'$/mathrm{I_{2}}$',1)hexagon_with_text(ax,8,14.5,'$/mathrm{I_{3}}$',1) arrow(ax,[3,8+np.cos(np.pi*3/3)],[23,22.5+np.sin(np.pi*3/3)],0.3,color='#b65576',linestyle='--')arrow(ax,[3,8+np.cos(np.pi*2/3)],[23,14.5+np.sin(np.pi*2/3)],0.3,color='#b65576',linestyle='--')arrow(ax,[3,8+np.cos(np.pi*4/3)],[17,22.5+np.sin(np.pi*4/3)],0.3,color='#b65576',linestyle='--')arrow(ax,[3,8+np.cos(np.pi*4/3)],[14,18.5+np.sin(np.pi*4/3)],0.3,color='#b65576',linestyle='--') arrow(ax,[3,8+np.cos(np.pi*3/3)],[20,18.5+np.sin(np.pi*3/3)],0.3,color='#b9b8bd',linestyle='--')arrow(ax,[3,8+np.cos(np.pi*3/3)],[17,14.5+np.sin(np.pi*3/3)],0.3,color='#b9b8bd',linestyle='--')arrow(ax,[3,8+np.cos(np.pi*3/3)],[14,14.5+np.sin(np.pi*3/3)],0.3,color='#b9b8bd',linestyle='--') ax.text(10.5,15,'${G_{r}}$',fontsize=20) circle_with_text(ax,4.2,10.5,'$/mathrm{U_{1}}$',1)circle_with_text(ax,9.0,10.0,'$/mathrm{U_{2}}$',1)circle_with_text(ax,8.5,5.8,'$/mathrm{U_{3}}$',1)circle_with_text(ax,3.8,6.8,'$/mathrm{U_{4}}$',1) theta=-np.pi/2-np.arctan2(9.0-4.2,10.0-10.5)arrow(ax,[9.0+np.cos(theta),4.2-np.cos(theta)],[10.0+np.sin(theta),10.5-np.sin(theta)],0.3,color='#8199bb') theta=-np.pi/2-np.arctan2(8.5-9.0,5.8-10.0)arrow(ax,[8.5+np.cos(theta),9.0-np.cos(theta)],[5.8+np.sin(theta),10.0-np.sin(theta)],0.3,color='#8199bb') theta=-np.pi/2-np.arctan2(3.8-4.2,6.8-10.5)arrow(ax,[3.8+np.cos(theta),4.2-np.cos(theta)],[6.8+np.sin(theta),10.5-np.sin(theta)],0.3,color='#8199bb') theta=-np.pi/2-np.arctan2(3.8-8.5,6.8-5.8)arrow(ax,[3.8+np.cos(theta),8.5-np.cos(theta)],[6.8+np.sin(theta),5.8-np.sin(theta)],0.3,color='#8199bb') theta=-np.pi/2-np.arctan2(4.2-8.5,10.5-5.8)arrow(ax,[4.2+np.cos(theta),8.5-np.cos(theta)],[10.5+np.sin(theta),5.8-np.sin(theta)],0.3,color='#8199bb') arrow_with_rad(ax,[4.2,3.8],[10.5,6.8],1.9,0.3,color='#8199bb') ax.text(10.5,8,r'${G_s}$',fontsize=20) circle_with_text(ax,25.0,19.0,'$/mathrm{U_{1}}$',1)circle_with_text(ax,35.0,17.0,'$/mathrm{U_{2}}$',1)circle_with_text(ax,32.0,8.0,'$/mathrm{U_{3}}$',1)circle_with_text(ax,24.0,10.0,'$/mathrm{U_{4}}$',1) hexagon_with_text(ax,32.5,14.0,'$/mathrm{I_{1}}$',1)hexagon_with_text(ax,23.0,16.0,'$/mathrm{I_{2}}$',1)hexagon_with_text(ax,27.0,13.0,'$/mathrm{I_{3}}$',1) theta=-np.pi/2-np.arctan2(35.0-25.0,17.0-19.0)arrow(ax,[35.0+np.cos(theta),25.0-np.cos(theta)],[17.0+np.sin(theta),19.0-np.sin(theta)],0.3,color='#8199bb') theta=-np.pi/2-np.arctan2(24.0-25.0,10.0-19.0)arrow(ax,[24.0+np.cos(theta),25.0-np.cos(theta)],[10.0+np.sin(theta),19.0-np.sin(theta)],0.3,color='#8199bb') theta=-np.pi/2-np.arctan2(24.0-32.0,10.0-8.0)arrow(ax,[24.0+np.cos(theta),32.0-np.cos(theta)],[10.0+np.sin(theta),8.0-np.sin(theta)],0.3,color='#8199bb') theta=-np.pi/2-np.arctan2(32.0-35.0,8.0-17.0)arrow(ax,[32.0+np.cos(theta),35.0-np.cos(theta)],[8.0+np.sin(theta),17.0-np.sin(theta)],0.3,color='#8199bb') theta=-np.pi/2-np.arctan2(25.0-32.0,19.0-8.0)arrow(ax,[25.0+np.cos(theta),32.0-np.cos(theta)],[19.0+np.sin(theta),8.0-np.sin(theta)],0.3,color='#8199bb') theta=-np.pi/2-np.arctan2(24.0-23-np.cos(np.pi*5/3),10.0-16.0-np.sin(np.pi*5/3))arrow(ax,[24.0+np.cos(theta),23.0+np.cos(np.pi*5/3)],[10.0+np.sin(theta),16.0+np.sin(np.pi*5/3)],0.3,color='#b65576',linestyle='--') theta=-np.pi/2-np.arctan2(32.0-32.5-np.cos(np.pi*4/3),8.0-14.0-np.sin(np.pi*4/3))arrow(ax,[32.0+np.cos(theta),32.5+np.cos(np.pi*4/3)],[8.0+np.sin(theta),14.0+np.sin(np.pi*4/3)],0.3,color='#b65576',linestyle='--') theta=-np.pi/2-np.arctan2(25.0-32.0-np.cos(np.pi*2/3),19.0-8.0-np.sin(np.pi*2/3))arrow(ax,[25.0+np.cos(theta),27.0+np.cos(np.pi*2/3)],[19.0+np.sin(theta),13.0+np.sin(np.pi*2/3)],0.3,color='#b65576',linestyle='--')arrow(ax,[25.0+np.cos(theta),32.5+np.cos(np.pi*3/3)],[19.0+np.sin(theta),14.0+np.sin(np.pi*3/3)],0.3,color='#b65576',linestyle='--') theta=-np.pi/2-np.arctan2(24.0-23-np.cos(np.pi*5/3),10.0-16.0-np.sin(np.pi*5/3))arrow(ax,[24.0+np.cos(theta),23.0+np.cos(np.pi*5/3)],[10.0+np.sin(theta),16.0+np.sin(np.pi*5/3)],0.3,color='#b65576',linestyle='--') theta=-np.pi/2-np.arctan2(35.0-23-np.cos(np.pi*0/3),17.0-16.0-np.sin(np.pi*0/3))arrow(ax,[35.0+np.cos(theta),23.0+np.cos(np.pi*0/3)],[17.0+np.sin(theta),16.0+np.sin(np.pi*0/3)],0.3,color='#b9b8bd',linestyle='--') theta=-np.pi/2-np.arctan2(24.0-27-np.cos(np.pi*4/3),10.0-13.0-np.sin(np.pi*4/3))arrow(ax,[24.0+np.cos(theta),27.0+np.cos(np.pi*4/3)],[10.0+np.sin(theta),13.0+np.sin(np.pi*4/3)],0.3,color='#b9b8bd',linestyle='--') theta=-np.pi/2-np.arctan2(32.0-27-np.cos(np.pi*5/3),8.0-13.0-np.sin(np.pi*5/3))arrow(ax,[32.0+np.cos(theta),27.0+np.cos(np.pi*5/3)],[8.0+np.sin(theta),13.0+np.sin(np.pi*5/3)],0.3,color='#b9b8bd',linestyle='--') arrow_with_rad(ax,[25,24],[19,10],4.8,0.3,color='#8199bb') bbox_props = dict(boxstyle="rarrow,pad=0.3", fc="#629cce", ec="#657084", lw=2) ax.text(16, 18, " "*15, ha="center", va="center", rotation=345, size=15, bbox=bbox_props) ax.text(16, 9, " "*15, ha="center", va="center", rotation=30, size=15, bbox=bbox_props) arrow(ax,[10,13],[24.5,24.5],0.3,color='#b65576',linestyle='--')arrow(ax,[20,23],[24.5,24.5],0.3,color='#b9b8bd',linestyle='--')arrow(ax,[27,30],[24.5,24.5],0.3,color='#8199bb') ax.text(9.5,24.5,'Purchase-P',fontsize=15,va='center',ha='right')ax.text(19.5,24.5,'Purchase-N',fontsize=15,va='center',ha='right')ax.text(26.5,24.5,'Trust',fontsize=15,va='center',ha='right') fig=plt.gcf()fig.set_size_inches(14, 8) ax.set_xlim(0,40)ax.set_ylim(0,25) plt.show() 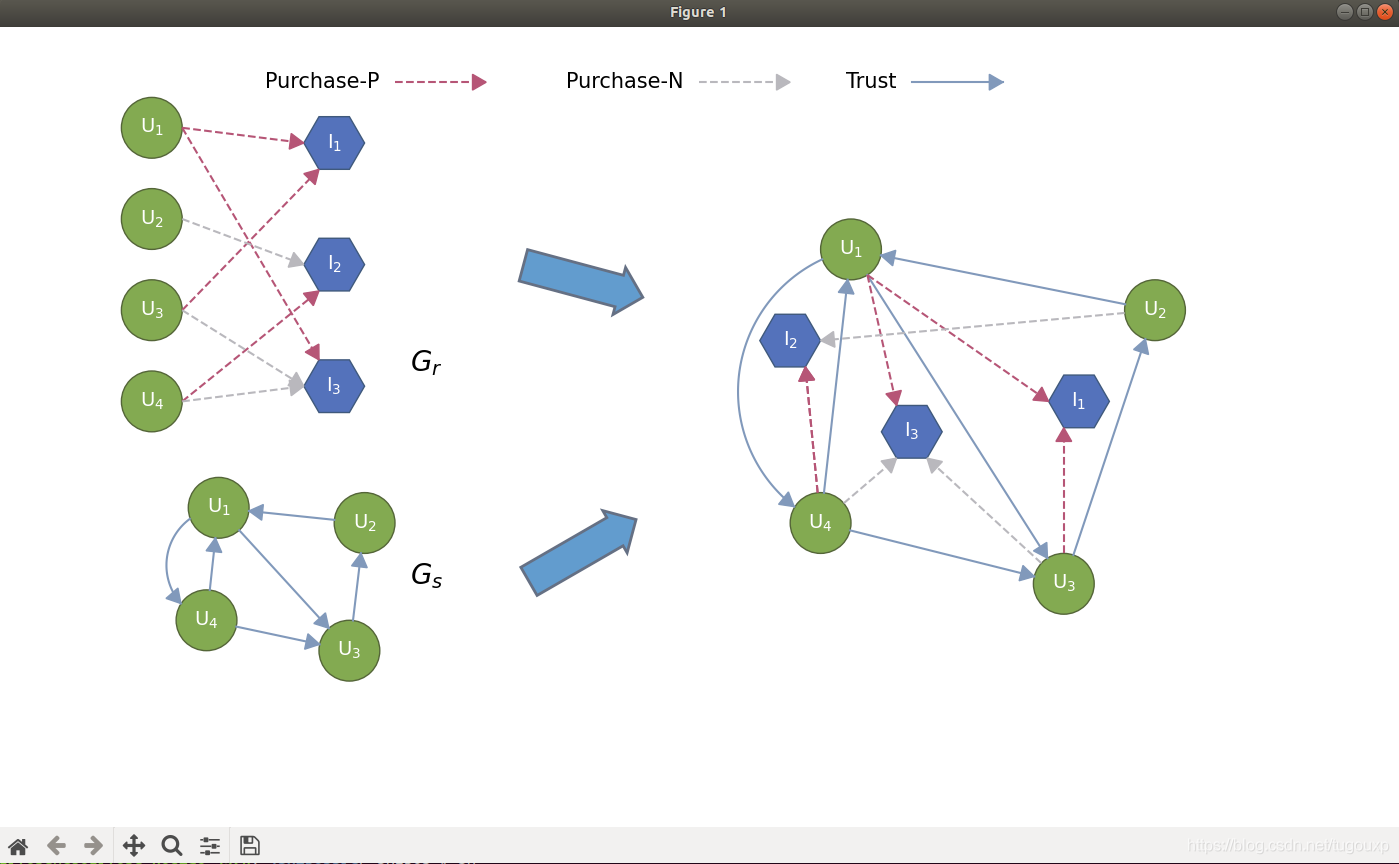
import numpy as npimport matplotlib.pyplot as pltimport matplotlib # matplotlib.rcParams['font.family'] = 'SimHei' size = 31#a = np.random.random(size)#b = np.random.random(size)#c = np.random.random(size)a=[9.30,16.34,9.68,16.96,12.19,9.58,5.65,4.89,7.37,8.44,15.64,14.04,13.30,1.97,34.28,55.18,41.80,53.95,38.84,196.85,450.36,81.79,127.43,46.91,71.44,27.21,36.85,78.30,49.91,66.96, 12.82]b=[9.81,17.11,10.14,17.32,12.45,9.79,5.88,4.95,7.55,8.50,15.72,14.12,13.38,2.19,34.60,55.86,42.37,54.20,40.75,199.53,453.62,82.92,129.45,47.41,71.99,27.51,38.16,80.26,51.22,67.78,13.05]c=[10.36,17.89,10.90,17.95,12.66,9.96,6.27,5.08,7.72,8.57,15.86,14.25,13.45,2.49,35.10,56.48,43.28,54.31,45.25,202.48,457.89,84.69,134.42,48.25,73.19,28.00,41.69,82.51,54.61,69.62,13.19] x = np.arange(size) total_width, n = 0.8, 3width = total_width / n str1 = ("squeezenet", "squeezenet_int8", "mobilenet", "mobilenet_int8", "mobilenet_v2", "mobilenet_v3", "shufflenet", "shufflenet_v2", "mnasnet", "proxylessnasnet", "efficientnet_b0", "efficientnetv2_b0", "regnety_400m", "blazeface", "googlenet", "googlenet_int8", "resnet18", "resnet18_int8", "alexnet", "vgg16", "vgg16_int8", "resnet50","resnet50_int8", "squeezenet_ssd","squeezenet_ssd_int8", "mobilenet_ssd","mobilenet_ssd_int8", "mobilenet_yolo", "mobilenetv2_yolov3","yolov4-tiny", "nanodet_m") x = x - (total_width - width) / 2 #plt.bar(x, a, width=width, label='min',tick_label=str1)#plt.bar(x+width, b, width=width, label='avg', tick_label=str1)#plt.bar(x+2*width, c, width=width, label='max',tick_label=str1)plt.bar(x, a, width=width, label='min')plt.bar(x+width, b, width=width, label='avg')plt.bar(x+2*width, c, width=width, label='max') #for a, b in zip(x, b):# plt.text(a, b + 0.05, '%.0f' % b, ha='center', va='bottom', fontsize=10) plt.legend()plt.show()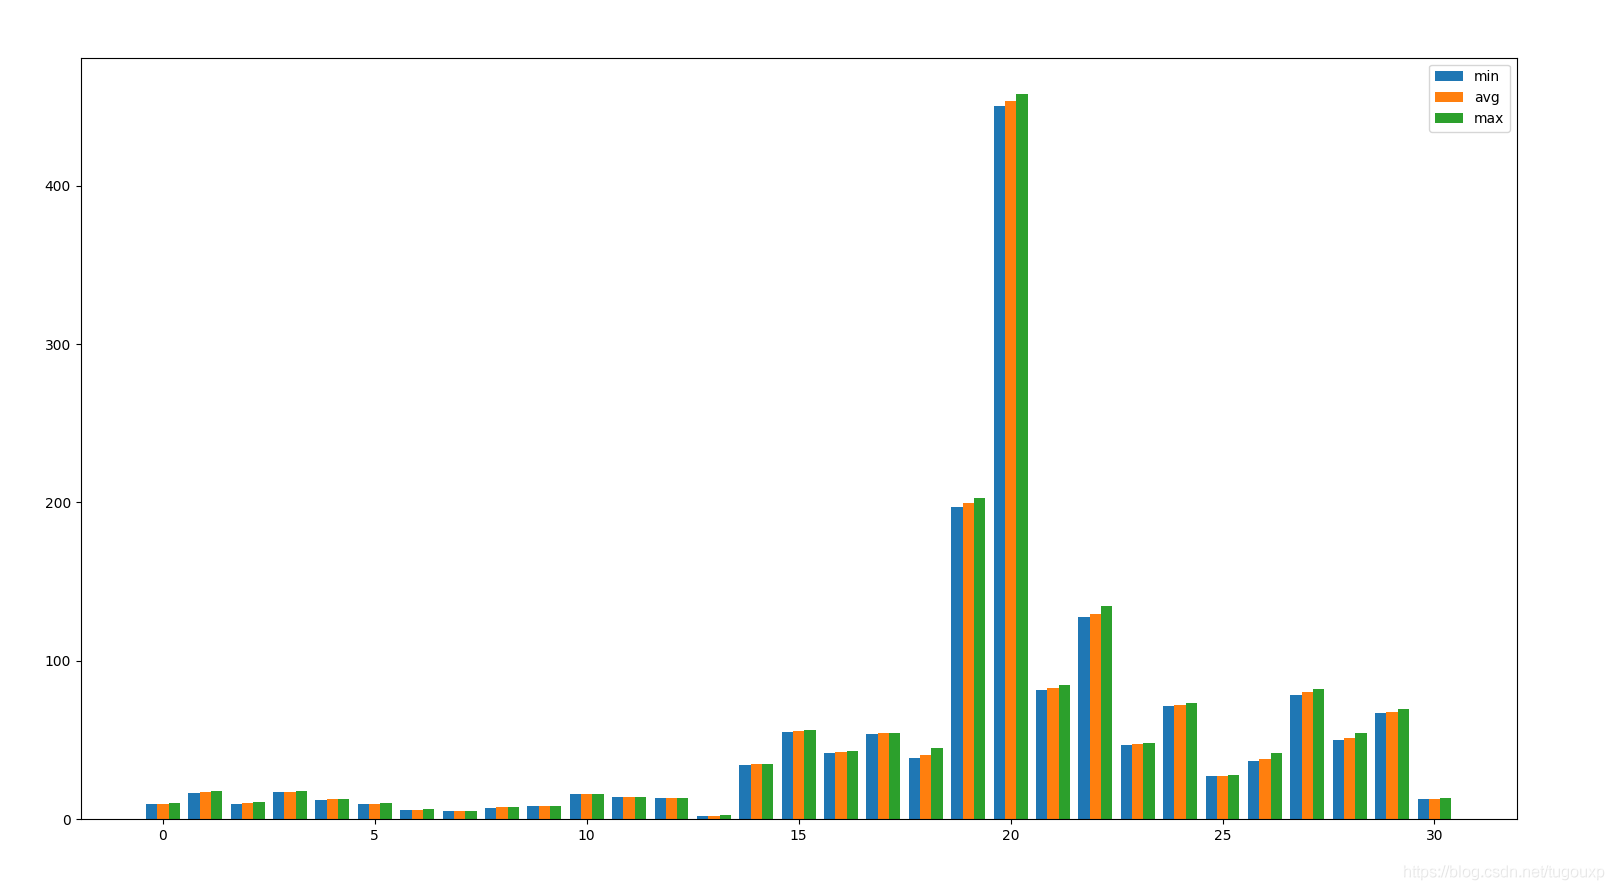
�ܽ�������ƪ��������Python����PPT�����¾ͽ��ܵ�����,�������Python����PPT����������51zixue.net��ǰ�����»�������������������ϣ������Ժ���֧��51zixue.net��
Python֮osģ�鰸�����
opencv-python ���������İ�װ�����ý̳���� |


